VERY IMPORTANT
Please go through the Article to get complete understanding of the components of 3Dot trading system
BUY, SELL and TRENDSTRENGTH LINE: Priority No 1 (by default these will be there)
We have tried our level best to keep system simple as possible, finally for any trader entry, exit and stop loss are main things to know to make it big in stock market. As you get the access please add the indicator to any of your charts, once you add the indicator to your chart, system will automatically generate BUY and SELL signals based on the various proprietor calculations and functions. Along with the Buy and sell signals below are the various added information which give more confirmations on the signals and gives you extra edge to your trading decisions.
You will see below signs on candle which will have specific meaning
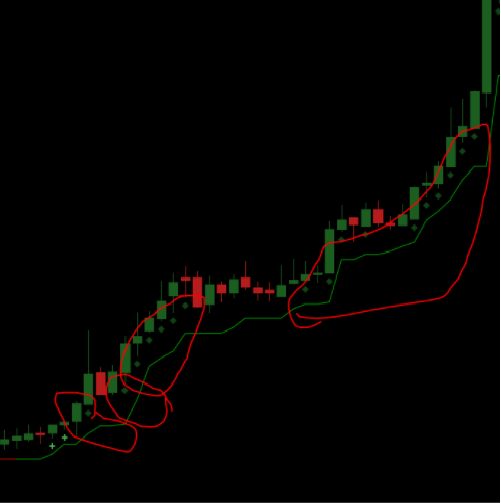
+ OR + Symbols above or below candle help us to ride the trend and emphasizes on trend continuation
● trend is turning super bullish
● trend is turning super bearish
Observe closely what has happened after we started Diamond green symbol below candles
TrendStrength is the line shown in below chart, it serves various purposes.
● Support
● Resistance
● Absolute big boss in figure out range bound market: if this line is flat for more than 2 candles you can think it is getting into range bound mode.
● Stop loss for a given trade: close below for buy trade / close above for sell trade

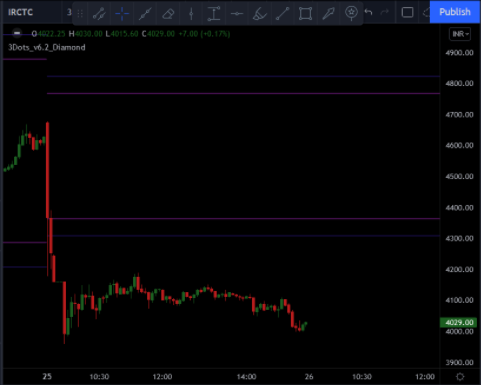
RANGE TRACK:
3 dot trading has come up with the calculation to find range for the day. This indicator will be plotted as first candle for the trading session is closed and it’s constant across any time frame. It’s static and does not change throughout the trading session.
In the below picture you see 2 Upper band lines acts as RESISTANCE and 2 lower band lines acts as SUPPORT.
Case 1: Price is getting restricted between those tracks AKA range track mostly guides to be there inside that range.
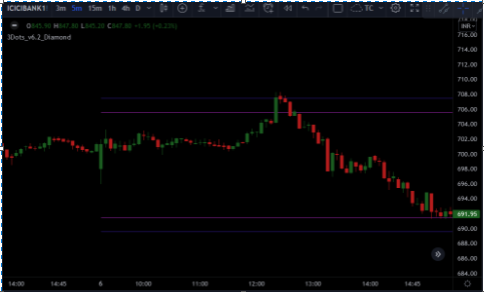
Case2: if the price manages to close above or below these tracks price tend to rally or fall ferociously from these levels.
Bullish Example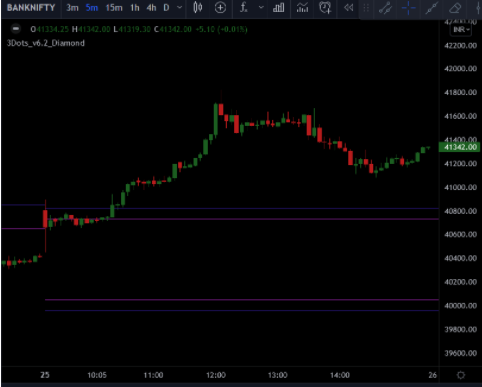 Bearish Example
MULTI TIME FRAME TREND:
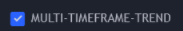
This is trend confirmation from different time frame; it has multiple boxes with colour codes.
It has 3, 5, 15, 60 and 1 Day boxes each showing different color. As the color gets from lighter to deeper it confirming strong trend on that time frame, we can gauge the market how the trend is there on different time frames with this.
In below example: On DAILY time frame trend is Bullish, but on 3, 5, 15, and Hrly time frame trend is bearish. This helps to double confirm the trend in tandem with our signals.

MARKET COMMENTARY:

What if you know in forehand the behaviour of the market going to be , that too knowing it is a range bound market before on hand is a big winning edge specially for buyers and awesomely for sellers, here we go . We have proprietary calculations to show cases different states of market and help and give a big edge along with signal confirmation
'Market is Range bound. Please wait....’
Avoid Signals if the market is range bound:
BUYING: Any of the below status along with our BUY signal is good for buy
With SL as TREND STRENGTH
'BULLISH: Zone entry'
Script entering its buy zone
'BULLISH: Breaking out'
Script is breaking out for a rally
'BULLISH: Super bullish'
Script is broken out and in a super bullish mode
'ULTRA BULLISH: dip is to buy'
Script has entered ultra-bullish territory any dip towards trend strength should be a good buy.
'BULLISH: Consolidation'
Overall sentiment is bullish and they are consolidating to take it higher levels
'BULLISH: Caution: Profit booking may start'
From a bullish territory price is closing below trend strength line, signals possible profit booking may start to be cautious.
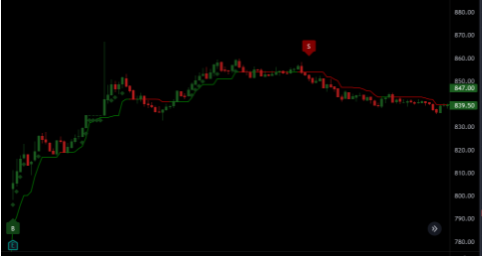
Below is the BUY example: Buy signal from the system with any of the above status from market commentary is good for buy
SELLING: Any of the below status along with our signal is good for SELL
With SL as TREND STRENGTH
'BEARISH: Zone entry'
Script entering its sell zone
'BEARISH: Breaking down'
Script is breaking down for a good fall
'BEARISH: Super Bearish'
Script is broken down and in a super bearish mode
'ULTRA BEARISH: Rise is to sell'
Script has entered ultra-bearish territory any rise towards trend strength should be a good sell.
'BEARISH: Consolidation
Overall sentiment is bearish and they are consolidating to sell it at higher levels
'BEARISH: Caution: Buying may emerge'
From a bearish territory price first time closed above TrendStrength line, signals possible reversal and buying may start to be cautious.
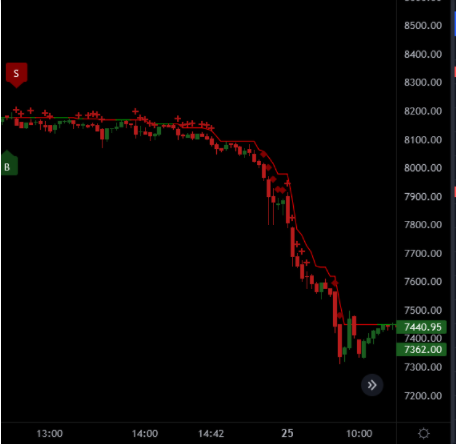
Below is the SELL example: SELL signal from the system with any of the above status from market commentary is good for Sell
AVOID SIGNALS ON RANGEBOUND MARKET:

When you enable this check box, signal are optimized by considering if the market is range bound , try not to give any signal if we find the market is ranging. Helps in avoiding unnecessary trades, usually where option buyers lose money and option seller make money. An algorithm omits trades for ranging market and so we will tend to see fewer signals for buy and sell. consider the points we get from these signals will be bigger for targets.
These signals can span across days, so we may not see any signals , for few days if previous signals is still valid for our conditions and there is no counter trade signal generated. Below is how you can trade intraday by enabling this mode.
If there is a signal generated on intraday chart go along with that, if you see there are no signals generated , please check last signals generated , it can be on same day or previous day or any of the previous days, go with those bias, let’s say previous signals was a buy signal , look all the opportunities to buy
BUY ENTRY in this scenario:
● Script should be trading above TrendStrength line
● Market commentary; should not be 'Market is Range bound. Please wait”
● It should any of BULLISH messages.
SL : closing below TrendStrength line
Like these there will be so many entries and exits
If the previous signal was SELLING, look only for SELLING opportunities,
SELL ENTRY this scenario:
● Script should be trading above TrendStrength line
● Market commentary; should not be 'Market is Range bound. Please wait”
● It should any of BEARISH messages.
SL : closing ABOVE TrendStrength
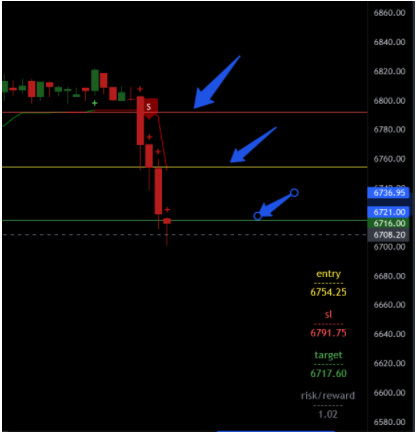
CURRENT TRADE AND TRADE LINES
System automatically calculates immediate target, stop loss levels and RISK to reward for the current trade once we get a BUY or SELL Signals. Which will be shown in chart and lines will be shown in chart as well.
OTHER INDICATORS FREEBEES
